New study finds that extremophile bacteria and archaea, microbes that diverged billions of years ago, can share strikingly similar genomic signatures when adapted to the same extreme environments
Evolutionary biologists have long known that DNA, the molecule that carries the genetic instructions for the development, functioning, growth and reproduction of all organisms, contains a record of ancestry. Indeed, the theory of common descent, a central pillar of modern evolutionary biology, holds that all life on Earth is related through an unbroken chain of genetic inheritance stretching back to a single ancestral organism in the distant past.
Making sense of that web of evolutionary relationships relies increasingly on computation. Lila Kari, a Professor at the Cheriton School of Computer Science, uses mathematical and computational techniques to analyze DNA sequences, classify organisms and understand how they are related.
But is ancestry the only story DNA tells? Could genomes also bear an imprint of the environments in which organisms evolved? According to a recent study, the answer, at least for some life forms and for some extreme environments, is an unexpected yes.
The focus of the study is an unusual group of organisms known as microbial extremophiles, microscopic species that thrive at the edges of biological tolerance, in environments that by human standards are inhospitable if not outright lethal.

L to R: Lila Kari and Monireh Safari, the authors of the study from the University of Waterloo.
Lila Kari is a Professor in the Cheriton School of Computer Science. Author of more than 250 peer-reviewed articles, she is regarded as one of the world’s experts in biomolecular computation. Her current research focuses on comparative genomics, biodiversity informatics, as well as theoretical aspects of bioinformation and biocomputation.
Monireh Safari is a fourth-year PhD student supervised by Professor Kari. Her research interests span machine learning and deep learning applications in genomics analysis, representation learning, and biodiversity analysis.
“Extremophiles are found in the harshest environments on Earth,” Professor Kari says. “They’ve been isolated from heated sediments near volcanoes, in deep-sea hydrothermal vents, in polar sea ice, almost every extreme environment biologists have examined for life.”
Some extremophiles, called hyperthermophiles, grow optimally at temperatures approaching 100°C. Others, known as psychrophiles, thrive at temperatures as low as -12°C. Still others inhabit highly acidic lakes with pH values near 0.5, highly alkaline lakes with pH around 11, or even solid rock several kilometres beneath the Earth’s surface.
Most extremophiles are bacteria and archaea, single-celled microbes so evolutionarily distant that they belong to different domains of life, the deepest division in the tree of life. Despite having diverged from one another about four billion years ago, researchers at the Cheriton School of Computer Science, working with colleagues at Western University and the University of Guelph, discovered that bacterial and archaeal extremophiles adapted to the same extreme environments can nonetheless exhibit strikingly similar genomic signatures.
To understand how the research team detected this unexpected environmental signal in microbial genomic signatures requires a short digression into the structure of DNA, mathematical ways to represent DNA sequences, and different kinds of machine learning techniques used for identification and classification.
Just as letters of the alphabet combine to form words, DNA molecules are composed of four “genetic” letters — the nucleotides adenine (A), cytosine (C), guanine (G), and thymine (T) — linked together along the DNA phosphate backbone to comprise an organism’s genome.
One way to visualize patterns in the frequency and arrangement of these nucleotide letters is using a mathematical technique called Chaos Game Representation. In CGR, a DNA sequence is plotted as a two-dimensional image that captures how often specific nucleotide patterns occur.
The illustration below shows how the short nucleotide sequence ACTCG is plotted (left), producing a simple image (right) that can be processed computationally.
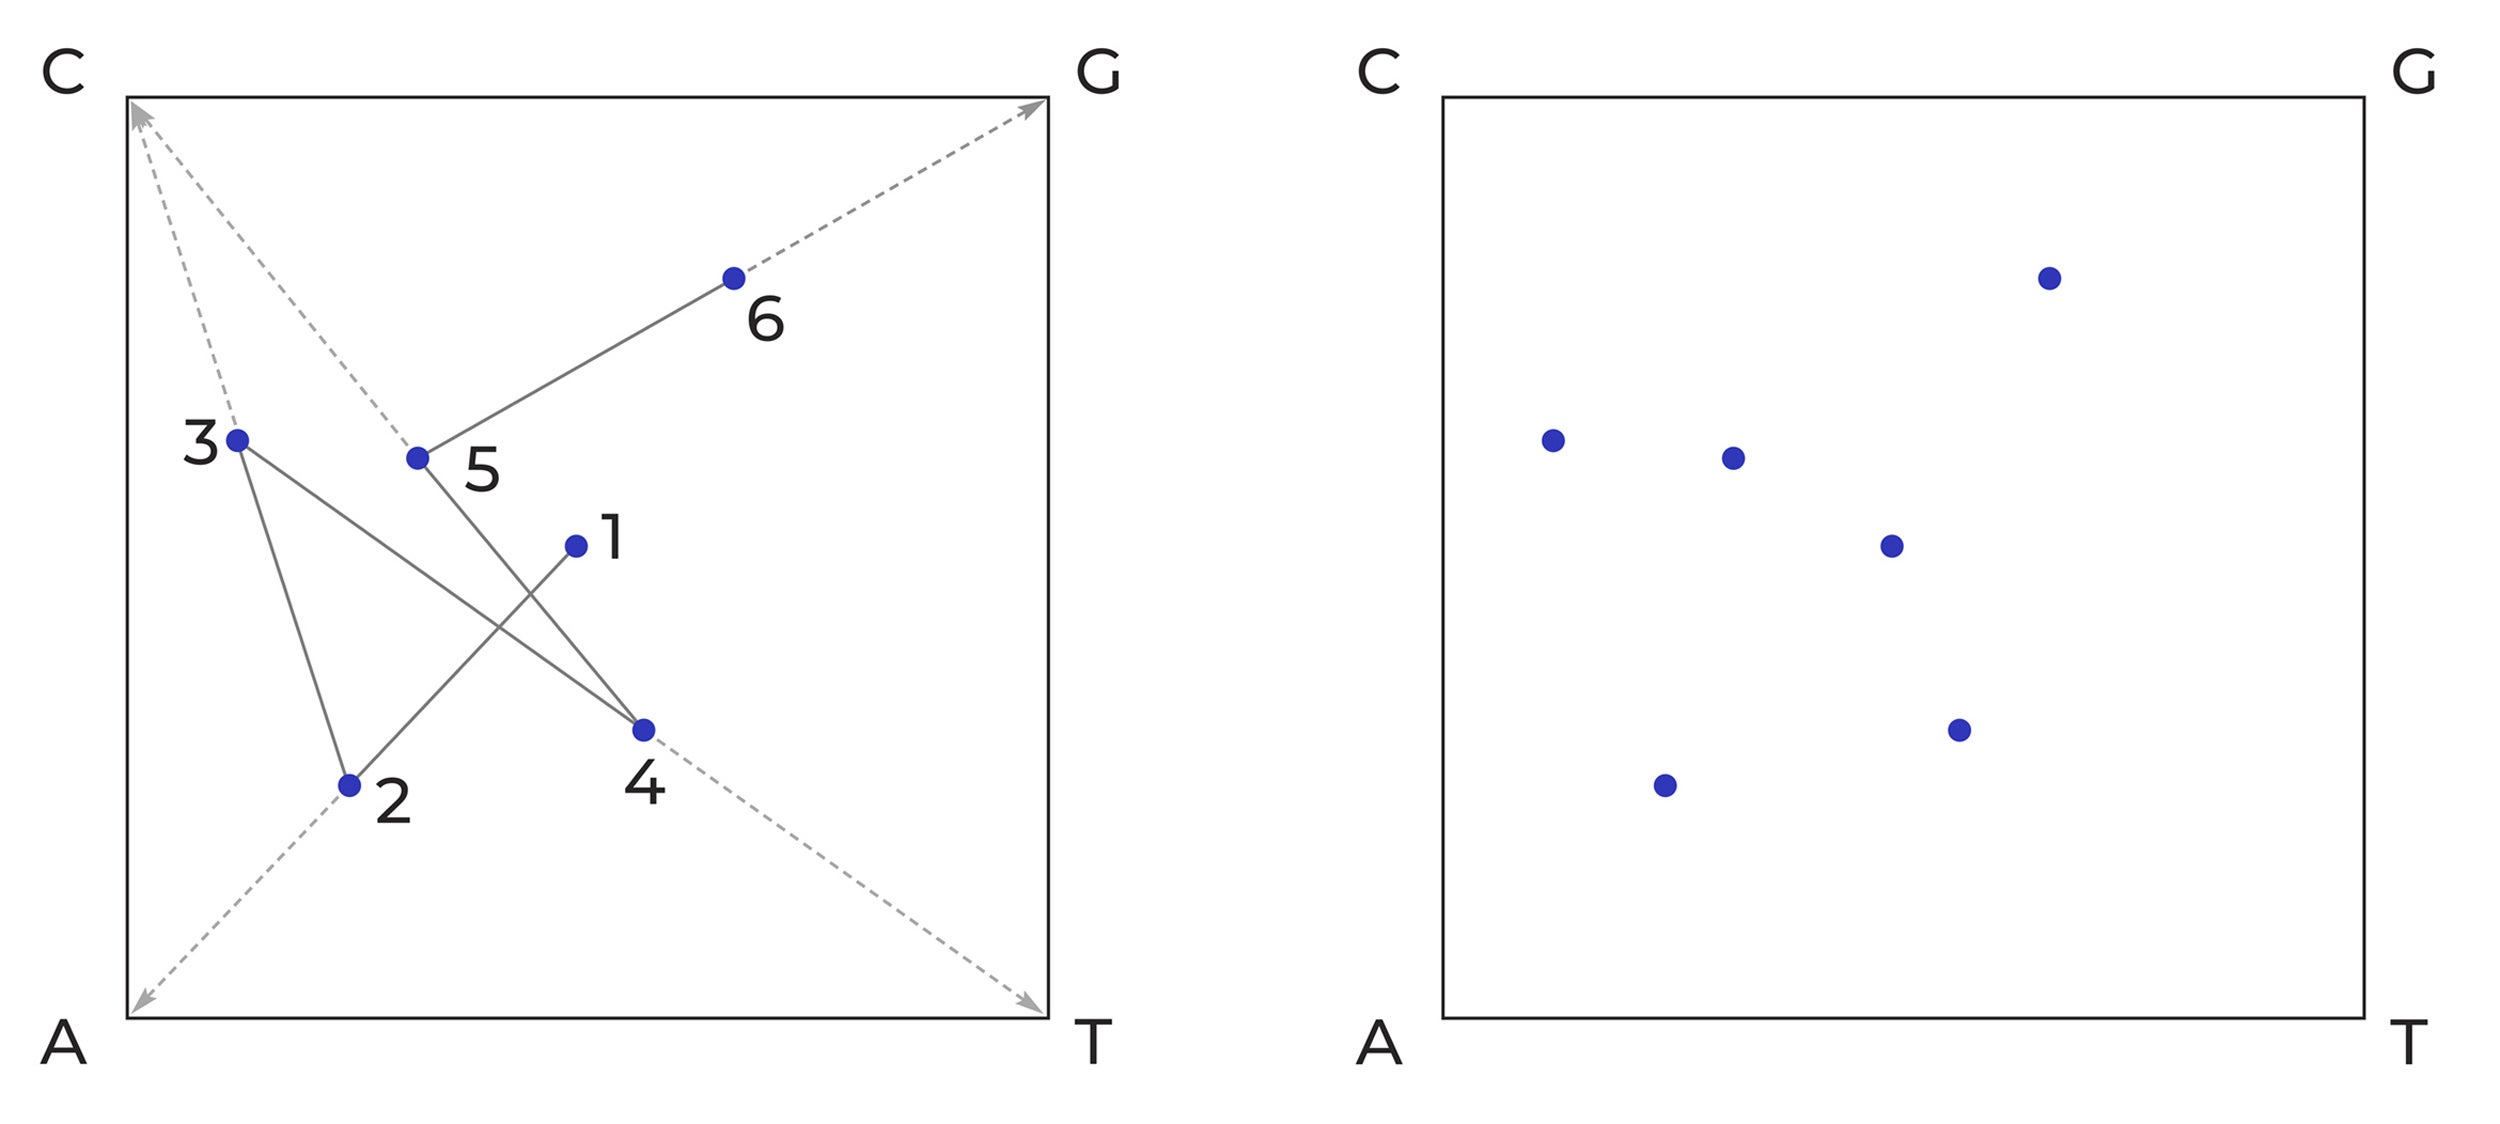
Chaos Game Representation of the nucleotide sequence ACTCG.
A dot is plotted at the centre of the square (1). A line is then drawn from the centre dot to the corner that corresponds to the first nucleotide (A in this example) in the DNA sequence. A new dot/pixel is then plotted at the midpoint of that line (2). Then a line is drawn from that dot to the corner corresponding to the next nucleotide (C) in the sequence. The next dot/pixel is placed at the midpoint of that line (3). The process is continued until all six nucleotides (ACTCG) have been plotted as pixels of a 2-dimensional image.
“If you plot longer DNA sequences, you find interesting, distinctive patterns,” Professor Kari said. “What’s remarkable is that these CGR patterns are species-specific, which makes them useful as genomic signatures.”
Crucially, the patterns are preserved regardless of where the sequence is sampled within the genome, provided the fragment is long enough.
“The first step was to choose a genome proxy for each extremophile, a DNA fragment long enough to represent the whole genome,” Professor Kari said. “In our study, the optimal length was 100,000 base pairs, which is about three per cent of the average extremophile genome. We didn’t take just one random segment, because we didn’t want to introduce bias.”
To compare genomes visually and quantitatively, the team used a refined version of CGR called frequency Chaos Game Representation. Like CGR, FCGR represents a genome as a two-dimensional image, but it includes even more information: the frequencies of what are known as k-mers, sequences of DNA nucleotide letters of length k.
For example, if the five-nucleotide sequence AGTCG appeared 20 times in a DNA fragment, that 5-mer would have a count of 20. From this k-mer data, a numerical vector of k-mer counts can be constructed for each DNA fragment, and it becomes the genomic signature unique to that organism. In an FCGR image, each pixel corresponds to a specific nucleotide sequence, and its intensity, how light or dark, reflects how often the k-mer count of that sequence appears in the genome.
Using an empirically determined optimal proxy of 100,000 base pairs and k=6, the researchers generated FCGRs for all 693 extremophile microbes in the study.
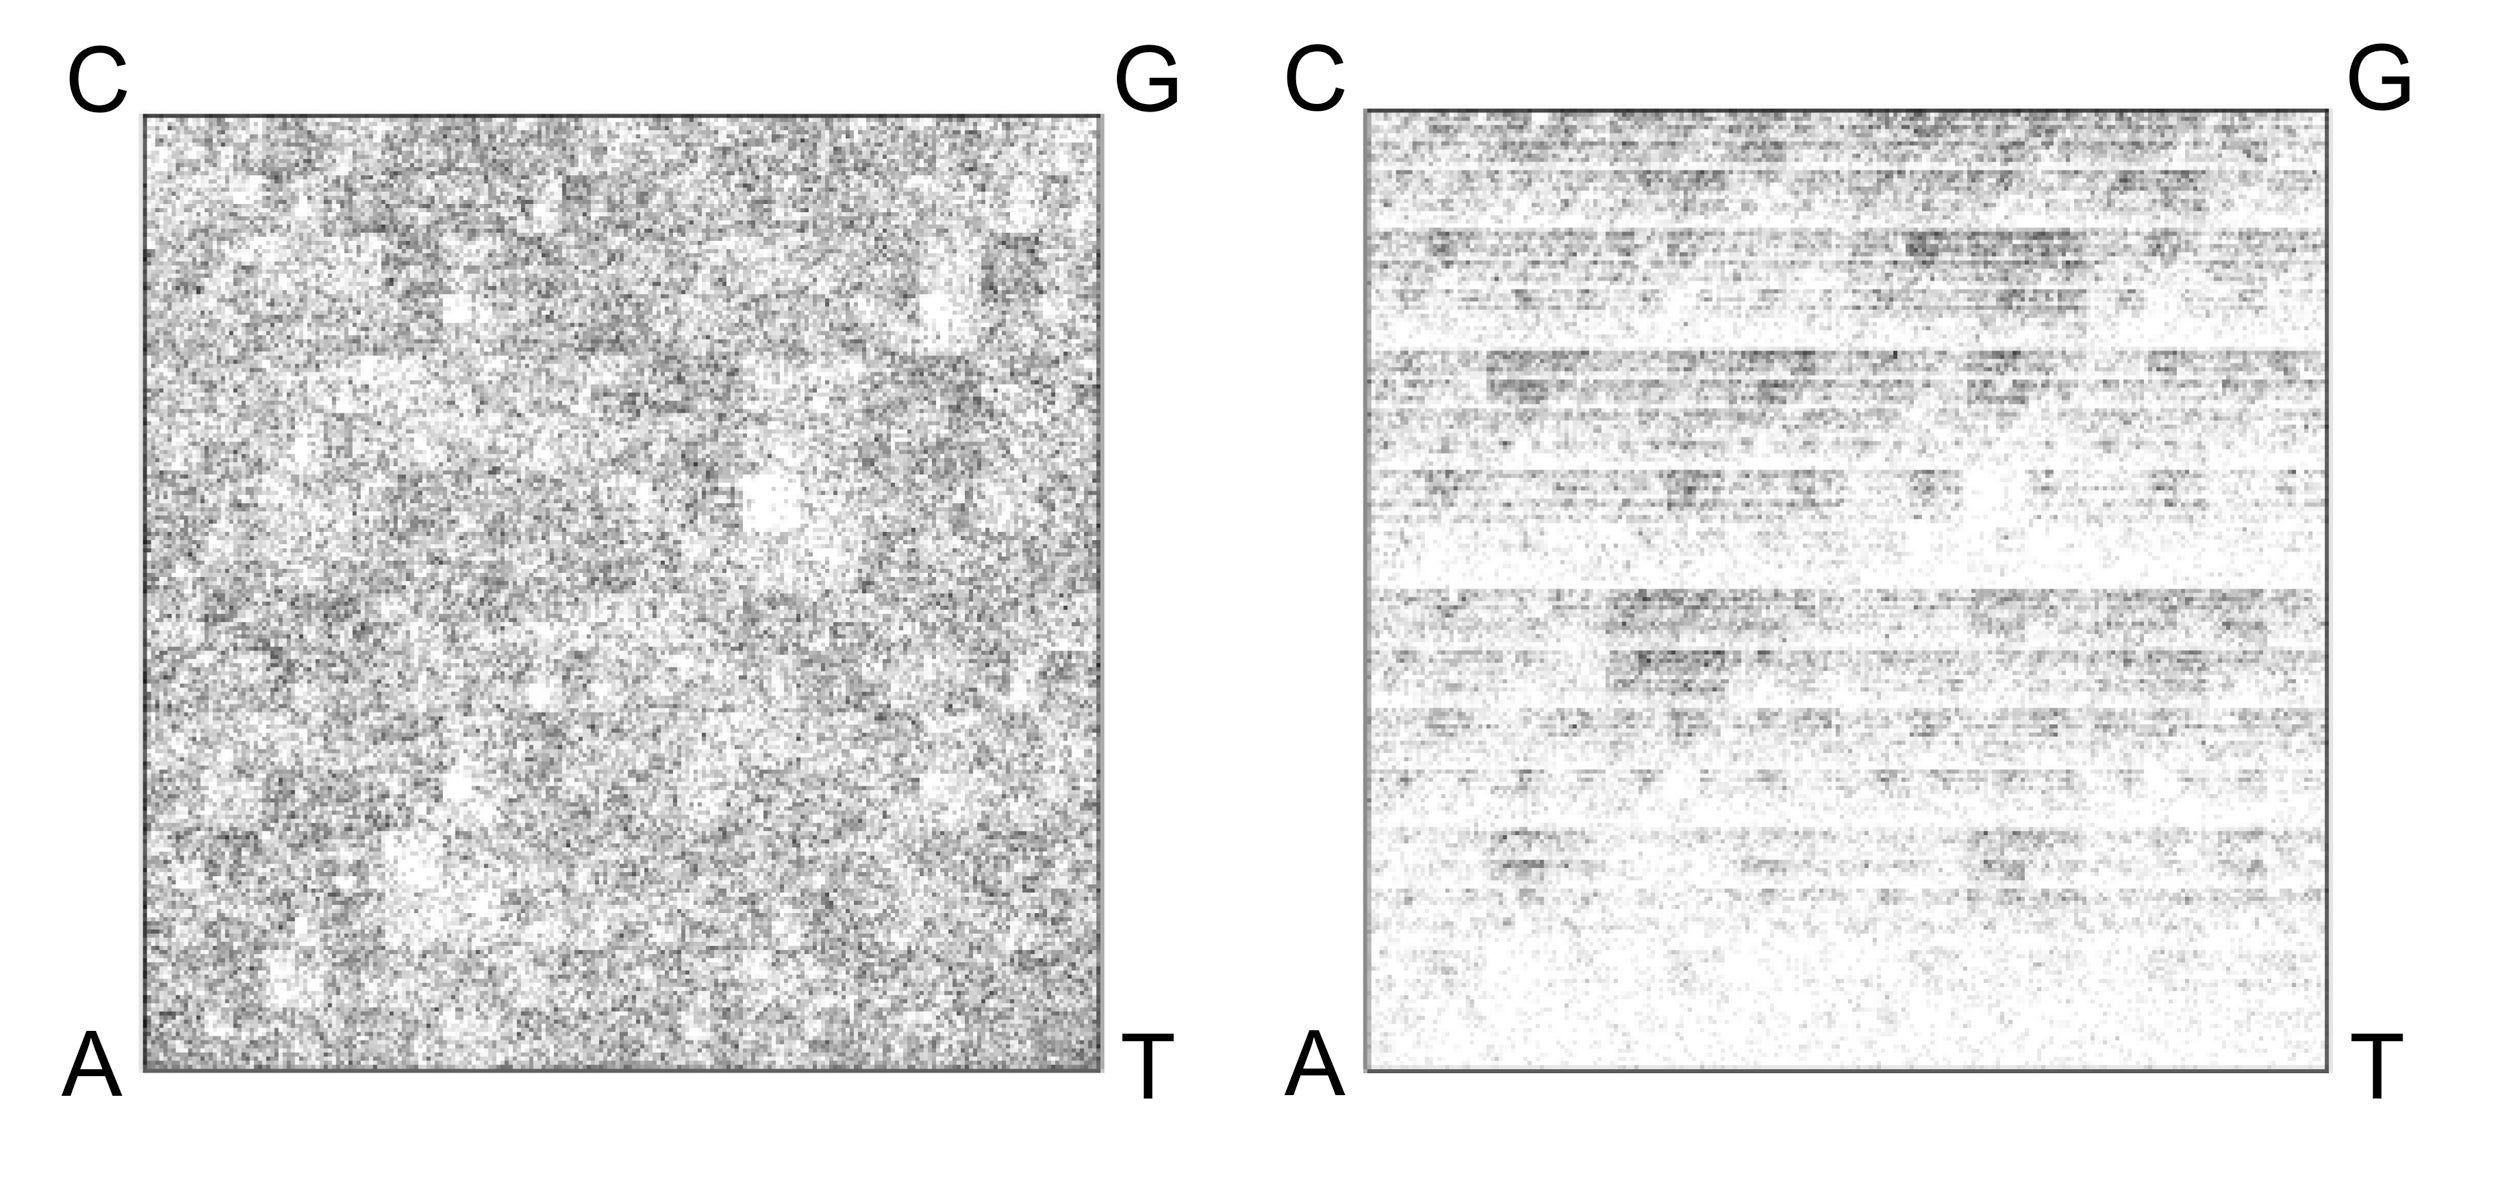
On the left is the FCGR of a fragment of the genome of Escherichia fergusonii, a bacterial microbe. On the right is the FCGR of a fragment of the genome of Halomicrobium mukohataei, an archaeon microbe. Darker pixels indicate higher frequencies of specific k-mers.
As expected, the two images are dissimilar, reflecting the deep evolutionary divide between bacteria and archaea.
“The traditional view is that DNA contains only information about ancestry — taxonomy, who you are, and phylogeny, what you’re related to,” Professor Kari said. “We wanted to confirm that this signal was in our dataset.”
Using supervised machine learning, the team trained algorithms to classify DNA sequences by domain of life. The model was shown sequences labelled as bacterial or archaeal, learned the distinguishing patterns, and was then tested on new, unknown sequences.
“As expected, the classification accuracy was extremely high, 99 per cent or better,” Professor Kari says. “That confirmed that the strongest signal in a genome’s k-mer profile is taxonomic.”
The researchers then asked a different question. Using the exact same genomic data, they retrained the algorithm, this time with environmental labels instead of taxonomic ones, and tested whether it could predict, say, whether an organism came from a hot or cold environment.
“The accuracy wasn’t as high as for taxonomy, but it was in the mid-70 per cent range,” Professor Kari says. “That’s far higher than random. It tells us some environmental information is embedded in these genomic signatures.”
To rule out the possibility that this result was an artifact of the model, the team then used unsupervised machine learning, which uses no prior information about taxonomy or environment.
“With unsupervised learning, you remove all labels,” Professor Kari explains. “You just give the algorithm the sequences and ask it to find what’s similar to what for whatever reason.”
As expected, most clusters reflected evolutionary relationships, but a small number did not.
“Some clusters contained both bacteria and archaea,” Professor Kari says. “That’s remarkable. The difference between bacteria and archaea is fundamental. They shouldn’t have similar genomic signatures at all.”
In total, the researchers identified 15 bacterial–archaeal pairs that clustered together despite their immense evolutionary distance. When they examined where those organisms had been isolated, a startling pattern emerged.
“They were found in similar extreme environments,” Professor Kari says. “The clustering wasn’t because of shared ancestry; it was because of shared environmental pressures. But the smoking gun is that for at least two pairs, not only were the bacterium and archaeon found in similar extreme environments but also in the same region geographically.”
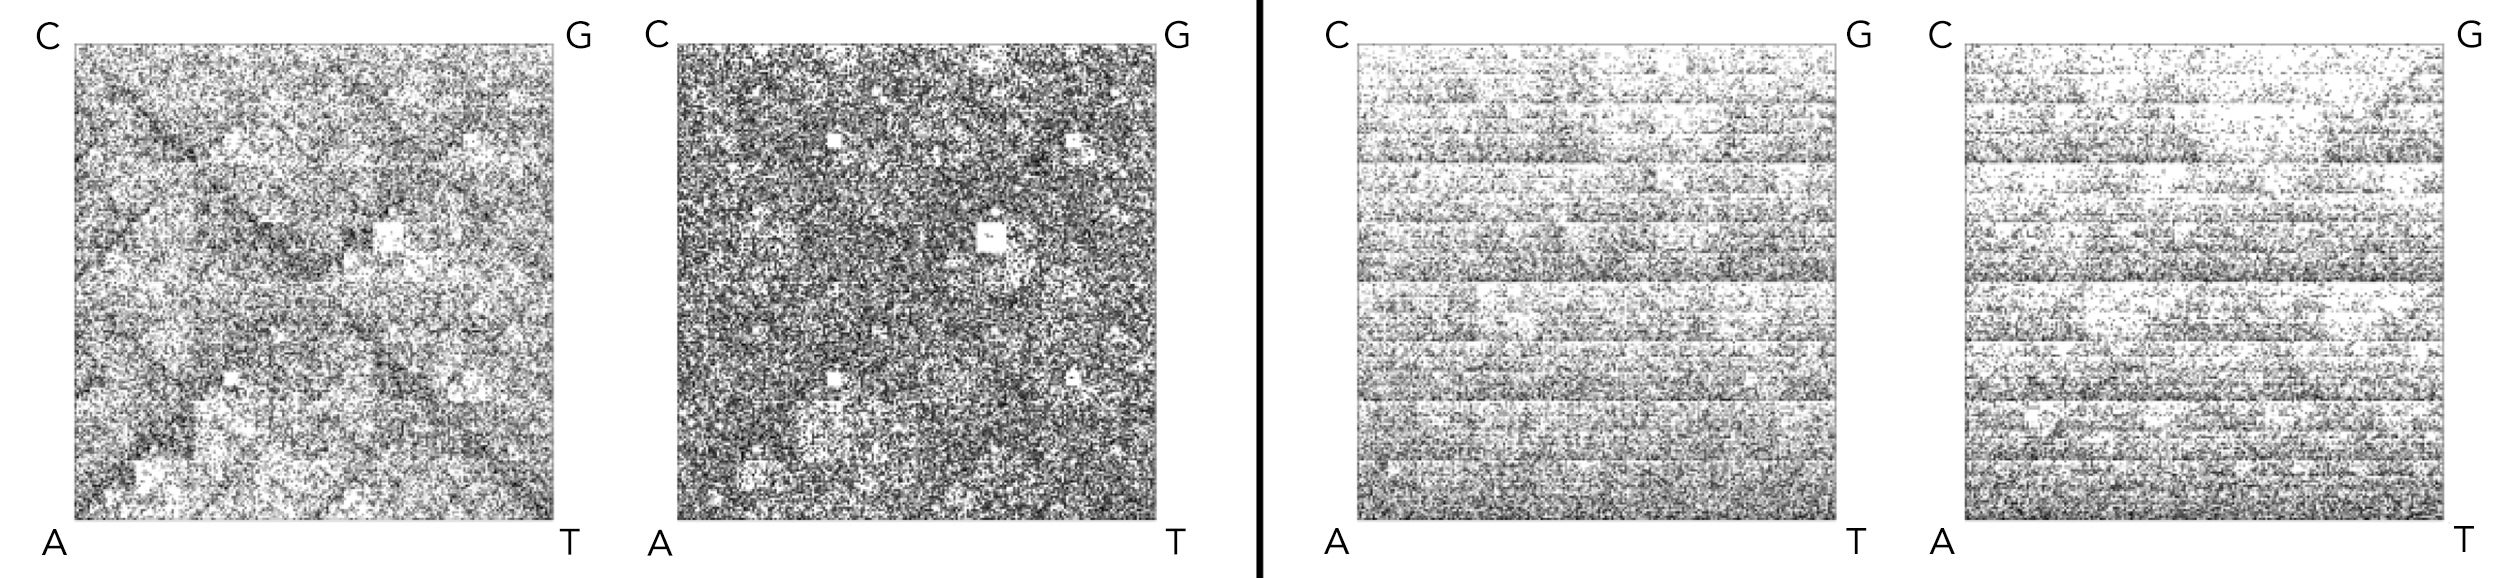
FCGR images of two confirmed candidate pairs (four unique species), with a resolution of k=8.
The first pair (set on left) includes a hyperthermophilic bacterium (Thermotoga petrophila) on left and a hyperthermophilic archaeon (Geoglobus acetivorans) on right.
The second pair (set on right) consists of an acidophilic thermophilic bacterium (Thermoanaerobacterium thermosaccharolyticum) on left and an acidophilic thermophilic archaeon (Caldisphaera lagunensis) on right.
In both candidate pairs, the FCGRs have strikingly similar patterns despite the species belonging to bacteria and archaea, different taxonomic domains.
One thermophilic, acidophilic bacterium–archaeon pair was found co-existing in Washburn Hot Springs in Yellowstone National Park. Another hyperthermophilic pair co-occurred in not only one, but two different locations: Brothers Volcano, a submarine volcano near New Zealand, and the Juan de Fuca Ridge, an underwater mountain range off the coast of Vancouver Island.
“We found that extreme environments can stamp a powerful, genome-wide watermark on DNA,” Professor Kari said. “Even microbes from the two most distant branches of life — bacteria and archaea — can end up with strikingly similar genomes, and in some cases we found these unlikely partners living side-by-side in the very same place.”
To learn more about the research on which this feature article is based, please see Monireh Safari, Joseph Butler, Gurjit S. Randhawa, Kathleen A. Hill, Lila Kari. Life at the extremes: maximally divergent microbes with similar genomic signatures linked to extreme environments. NAR Genomics and Bioinformatics, Volume 7, Issue 4, December 2025.
Maximally divergent microbes with strikingly similar genomic signatures linked to extreme environment: the hyperthermophilic bacterium (Thermotoga petrophila) on left and a hyperthermophilic archaeon (Geoglobus acetivorans) on right.