Runge.mw

Illustration of the Runge Phenomenon 

Summary 

Given a set of Typesetting:-mrow(Typesetting:-mi( data points, interpolation by a polynomial of degree Typesetting:-mrow(Typesetting:-mi(can be bad when Typesetting:-mrow(Typesetting:-mi(is large. 


Define a function 

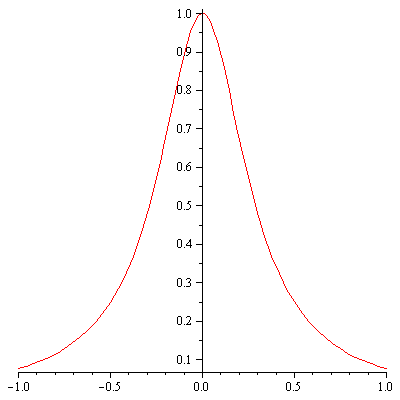
As an example, consider the smooth function  Typesetting:-mrow(Typesetting:-mi(. 

> Typesetting:-mrow(Typesetting:-mi(
 

> `:=`(f, proc (x) options operator, arrow; `/`(1, `*`(`+`(1, `*`(12, `*`(`^`(x, 2)))))) end proc)
 

proc (x) options operator, arrow; `/`(1, `*`(`+`(1, `*`(12, `*`(`^`(x, 2)))))) end proc (1)
 

> plot(f, -1 .. 1)
 

Plot_2d
 

> `:=`(functionPlot, %); -1


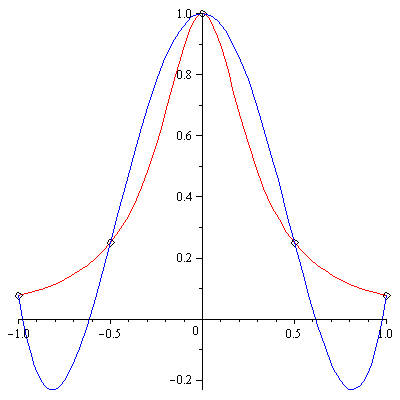
Interpolate at 5 equally-spaced points 


> `:=`(npts, 5)
 

5 (2)
 

> `:=`(xpts, [seq(`+`(`-`(1), `/`(`*`(`*`(2, `+`(i, `-`(1)))), `*`(`+`(npts, `-`(1))))), i = 1 .. npts)])
 

[-1, -`/`(1, 2), 0, `/`(1, 2), 1] (3)
 

> `:=`(xpts, evalf(xpts))
 

[-1., -.5000000000, 0., .5000000000, 1.] (4)
 

> `:=`(ypts, map(f, xpts))
 

[0.7692307692e-1, .2500000000, 1., .2500000000, 0.7692307692e-1] (5)
 

>
 

> `:=`(DataPoints, [seq([xpts[i], ypts[i]], i = 1 .. npts)]); -1
 

> `:=`(DataPlot, plot(DataPoints, x = -1 .. 1, style = point, symbol = circle, colour = black, symbolsize = 16)); -1
`:=`(DataPlot, plot(DataPoints, x = -1 .. 1, style = point, symbol = circle, colour = black, symbolsize = 16)); -1
 

>
 

> with(CurveFitting); -1
 

> `:=`(interpPoly, PolynomialInterpolation(xpts, ypts, x))
 

`+`(`*`(2.769230768, `*`(`^`(x, 4))), `-`(`*`(0.1e-8, `*`(`^`(x, 3)))), `-`(`*`(3.692307691, `*`(`^`(x, 2)))), `*`(0.12e-8, `*`(x)), 1.000000000) (6)
 

> `:=`(interpPlot, plot(interpPoly, x = -1 .. 1, colour = blue)); -1
 

> plots:-display(functionPlot, DataPlot, interpPlot)
 

Plot_2d
 

>


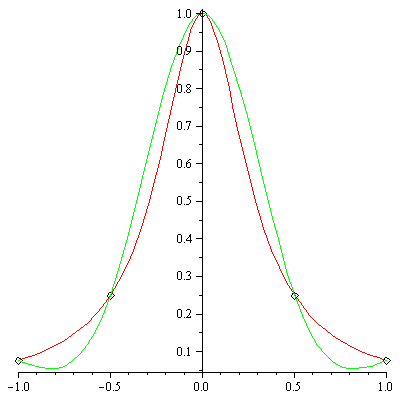
A cubic spline fit does much better 


> `:=`(SplineFit, Spline(xpts, ypts, x)); -1
 

> `:=`(SplinePlot, plot(SplineFit, x = -1 .. 1, colour = green)); -1
 

> plots:-display(functionPlot, DataPlot, SplinePlot)
 

Plot_2d
 

>


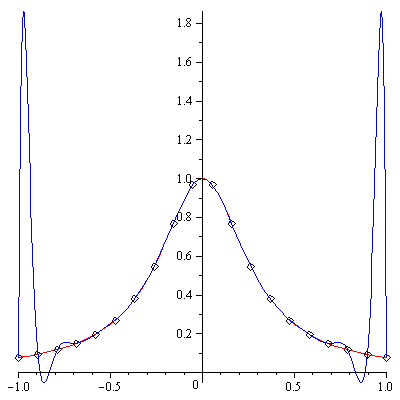
Interpolate at a larger number of equally-spaced points 


> `:=`(npts, 20)
 

20 (7)
 

> `:=`(xpts, [seq(`+`(`-`(1), `/`(`*`(`*`(2, `+`(i, `-`(1)))), `*`(`+`(npts, `-`(1))))), i = 1 .. npts)]); -1
 

> `:=`(xpts, evalf(xpts)); -1
 

> `:=`(ypts, map(f, xpts)); -1
 

>
 

> `:=`(DataPoints, [seq([xpts[i], ypts[i]], i = 1 .. npts)]); -1
 

> `:=`(DataPlot, plot(DataPoints, x = -1 .. 1, style = point, symbol = circle, colour = black, symbolsize = 16)); -1
`:=`(DataPlot, plot(DataPoints, x = -1 .. 1, style = point, symbol = circle, colour = black, symbolsize = 16)); -1
 

>
 

> `:=`(interpPoly, PolynomialInterpolation(xpts, ypts, x)); -1
 

> `:=`(interpPlot, plot(interpPoly, x = -1 .. 1, colour = blue)); -1
 

> plots:-display(functionPlot, DataPlot, interpPlot)
 

Plot_2d
 

>


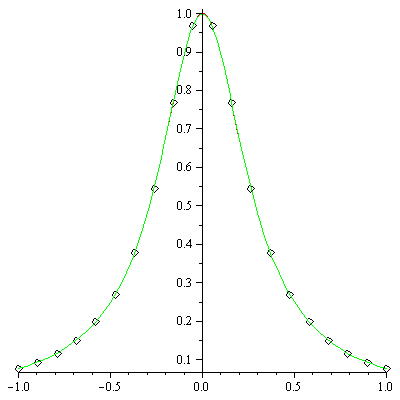
A cubic spline fit does much better 


> `:=`(SplineFit, Spline(xpts, ypts, x)); -1
 

> `:=`(SplinePlot, plot(SplineFit, x = -1 .. 1, colour = green)); -1
 

> plots:-display(functionPlot, DataPlot, SplinePlot)
 

Plot_2d
 

>