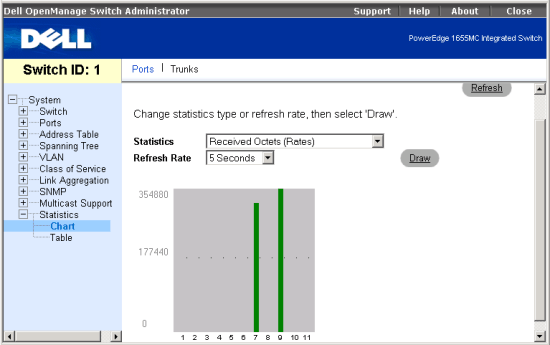
From the Statistics menu, you can chart a variety of system data. You can see the value of each bar or line in the chart by clicking on the bar. For each chart, after you have set all the variables, click Draw.
| NOTE: Rates are displayed as counts per second. Counters are cumulative from the last time the system was booted. |
The Statistics menu contains links to the following pages:
