
COVID-19 Dashboard
During my PhD, I took a course on data visualization taught by Prof. Jian Zhao.
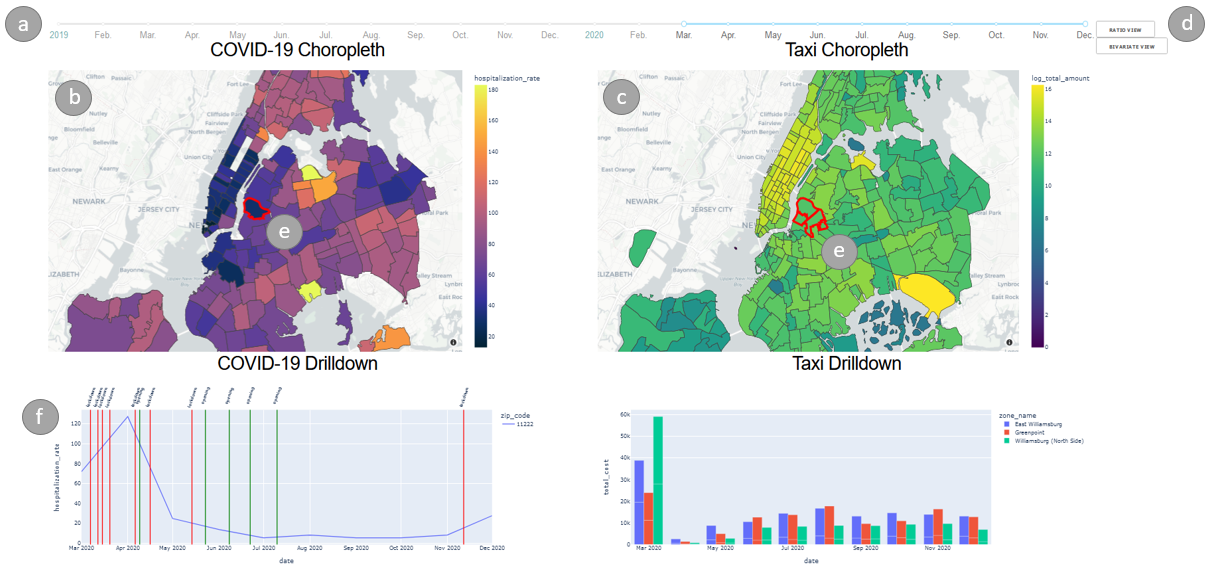
For the final project, our group built an interactive dashboard to explore taxi-usage data alongside COVID-19 trends. The dashboard supports multiple visualizations and views to make it easy to investigate the data and uncover potentially interesting correlations.
Links
- 💻 Code