Plot Examples 8 and 9 from GroebnerIntro
Example 8: Plot
| > | restart; |
| > | p1 := x^2 + y*z - 2: |
| > | p2 := y^2 + x*z - 3: |
| > | p3 := x*y + z^2 - 5: |
| > | F := [p1, p2, p3]; |
![]()
| > | with(plots): |
| > | implicitplot3d(p1, x=-5..5, y=-5..5, z=-5..5, axes=boxed); |
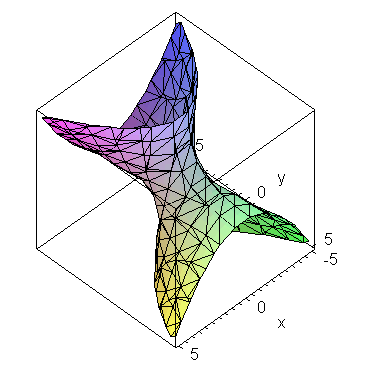
| > | implicitplot3d(p2, x=-5..5, y=-5..5, z=-5..5, axes=boxed); |
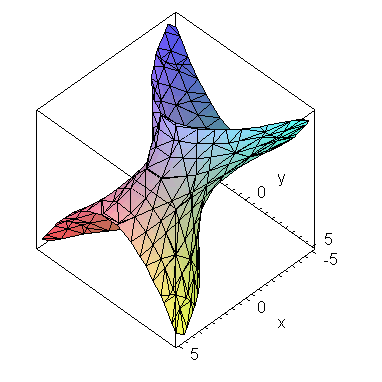
| > | implicitplot3d(p3, x=-5..5, y=-5..5, z=-5..5, axes=boxed); |
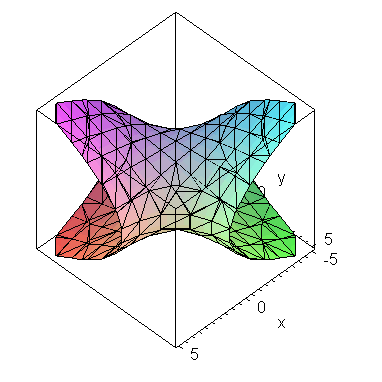
| > | implicitplot3d([p1,p2,p3], x=-5..5, y=-5..5, z=-5..5,
axes=boxed, color=[red,blue,yellow]); |
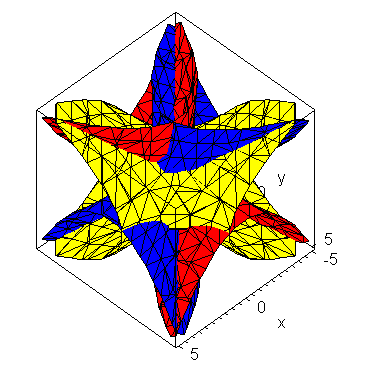
| > |
Example 9: Plot
| > | restart; |
| > | f1 := 4*x^2 + x*y^2 - z + 1/4: |
| > | f2 := 2*x + y^2*z + 1/2: |
| > | f3 := x^2*z - 1/2*x - y^2: |
| > | F := [f1, f2, f3]; |
![[4*x^2+x*y^2-z+1/4, 2*x+y^2*z+1/2, x^2*z-1/2*x-y^2]](images/PlotEx8-9_6.gif)
| > | with(plots): |
| > | implicitplot3d(f1, x=-10..10, y=-10..10, z=-10..10, axes=boxed); |
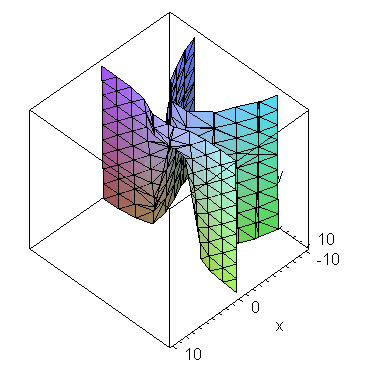
| > | implicitplot3d(f2, x=-10..10, y=-10..10, z=-10..10, axes=boxed); |
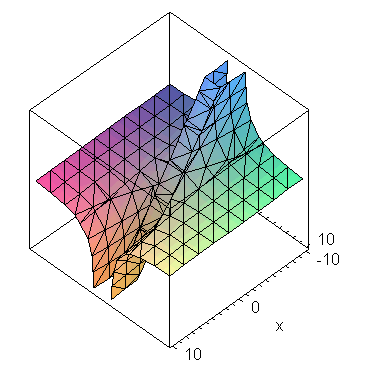
| > | implicitplot3d(f3, x=-10..10, y=-10..10, z=-10..10, axes=boxed); |
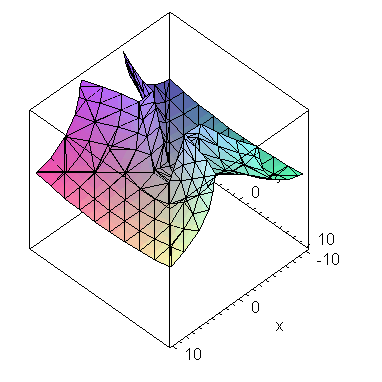
| > | implicitplot3d([f1,f2,f3], x=-10..10, y=-10..10, z=-10..10,
axes=boxed, color=[red,blue,yellow]); |
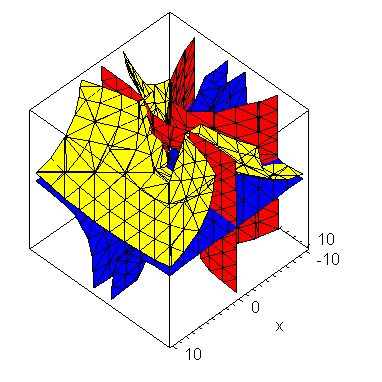
| > |
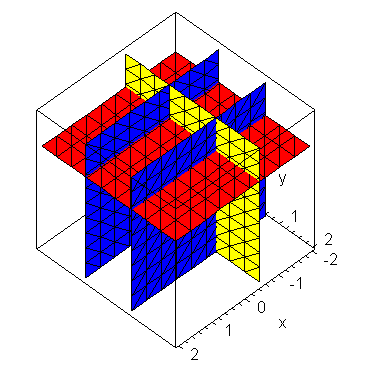
The first subsystem G1
| > | G1 := [z-1, 2*y^2-1, 2*x+1]; |
![]()
| > | implicitplot3d(G1, x=-2..2, y=-2..2, z=-2..2,
axes=boxed, color=[red,blue,yellow]); |
| > |
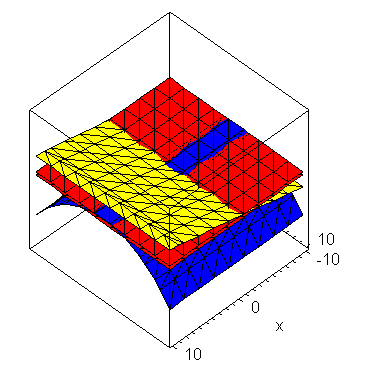
The second subsystem G2
| > | G2 := [16*z^6+8*z^5+9*z^4+61*z^3+136*z^2-206*z+60, 284*y^2+5664*z^5+5568*z^4+5866*z^3+24365*z^2+59937*z-43978, 568*x-2736*z^5-2680*z^4-2771*z^3-11793*z^2-28946*z+21382]; |
![]()
![]()
![]()
![]()
![]()
| > | implicitplot3d(G2, x=-10..10, y=-10..10, z=0..1,
axes=boxed, color=[red,blue,yellow]); |
| > |